


Cyber Security behavior can be analyzed in the SIEMs that continuously advance, incorporating new features and expanding their capabilities to stay ahead of attackers. One such addition that has gained prominence is the utilization of interactive Cyber Security Visualizations – the visualization of data in interactive graphs and diagrams to enhance threat investigation.
However, even one of the most notable attempts in this area, the Microsoft Sentinel Investigative Graph, has received lukewarm reviews. It does not match the cyber security behavior of the working force. Our ambition is to address user needs, preferences, and workflow more efficiently, by adopting a user-centric design approach to create an interactive data visualization experience tailored specifically for cyber security defenders.
Cyber Security Behavior: New Potential in Tools for Defenders
At the heart of this approach is the recognition that true empowerment in cyber security hinges on the personnel, and that SIEMs and other tools are merely amplifiers and enablers for the inherent abilities of the defenders. This is true for the automation of cyber security as well: It’s about amplifying abilities and extending reach, focusing expertise on the work that matters. Picking the right tools will take the defender’s abilities to new heights, and picking the wrong ones can have disastrous outcomes. Ensuring the software is designed with this in mind, that the user should be empowered, and their abilities amplified, is why we rely on meticulous user studies, transforming user instincts, preferences, and expertise into a dynamic synergy with our software and data.
True empowerment hinges on the personnel. Tools merely amplify abilities
Welcome back to this series of blog posts discussing the collaborative project funded by DigitalLead Cyber and involving Seculyze, TrueSec (formerly Venzo_), and IT University of Copenhagen. In the previous blog post, we explored the efforts that led us to move away from conventional lists and towards interactive graphs. We delved into the strategies used to address visualization challenges by drawing inspiration from other fields of data representation and integrating creative visualization concepts into user-friendly tools designed for cyber security experts. Now, we’re prepared to delve into the first user study conducted in creating the prototype of our interactive data visualization for cyber security threat analysis
User Study of Cyber Security Behavior: The Incident Investigation Workflow
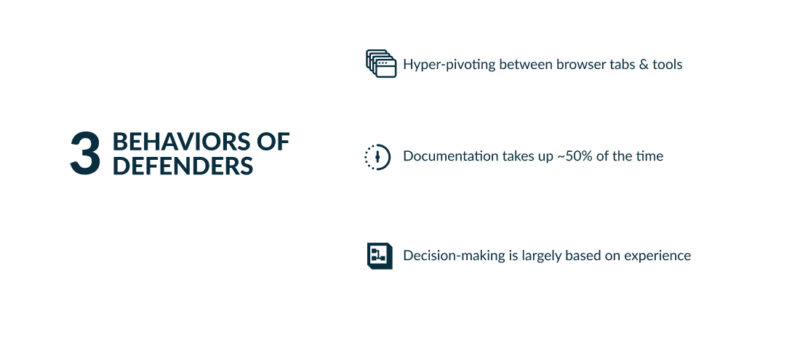
Given that this project’s interactive data visualization aims to streamline threat investigation workflows, it was essential to examine such workflows behavior. Our initial user study revealed three specific cyber security behaviors that our design must consider.
-
User constantly pivots between a multitude of tabs and tools.
-
Documentation consumes about 50% of total time spent.
-
Decision-making is largely based on experience.
Let’s go at them one by one, to discuss the cyber security behavior and to opening the conversation on possible ways to support them.
1. Hyper-pivoting Between Browser Tabs and Tools
The first cyber security behavior will not be a surprise to anyone who has engaged in threat investigation: Repeated and frequent pivoting between different tabs and tools. Third-party enrichment tools: virustotal, urlscan, whois, base64decode and shodan, to name a few stables, are part of this enrichment process. However, third party enrichment tools are not the only additions defenders use to support their workflow within SIEMs. Tools used for tasks not directly related to the threat, such as enhanced screenshotting tools, communication platforms, and project management boards, also significantly contribute to the abundance of tools.
To accommodate this cyber security behavior, in the name of user-centric design, our software could empower and facilitate information exchanges between our data visualization and third party software. For example lessening friction with easy copy/pasting formatting in the UI and offer instant server synchronization to enable multiple tabs of the software to be open at once. Another solution for this could be to incorporate select data enrichment tools directly in the visualization, reducing the need for pivoting to other software.


2. Documentation Takes Up ~50% of the Time
On to the study’s second identified cyber security behavior: about 50% of the time during the threat investigation process is spent documenting and communicating the investigation and its conclusions. It’s worth noting that these initial findings were derived from interactions with cybersecurity consultancies, which might result in a slightly higher percentage compared to internal security teams. Further interviews confirmed that not only does communicating the process and findings of threat investigations take up a significant amount of time, but it also strongly influences the success of effective threat mitigation in cyber security.
Given the significant role that documentation plays in the workflow, our design could streamline sharing, encompassing both findings and interactions with the graph. Possible solutions might involve auto-logging steps to a digital journal, enabling analysts to revisit actions during later documentation – an opportunity for generative AI to shine for sure. Additionally, enhancing screen capture views for defenders to annotate, draw, and discuss ideas directly on the graph before exporting could improve the integration of our data visualization into the existing workflow and behavior of cybersecurity defenders


3. Decision-making Is Largely Based on Experience
The final key cyber security behavior to touch on in this post, concerns decision-making. We noticed, in almost all of the work, analysts disregarding certain tool warnings, detections, and recommendations from the software. This was handled surprisingly confidently, attributed to both analysts’ experience and shared insights from colleagues. To perpetually support experience exchange and enable optimal analyst performance, our design must consider this behavior.
A practical software implementation could be an interactive playbook environment for cybersecurity teams. With software assistance, they’d craft and share real-world experience-based decision-making scenarios, outlining attack situations, correlated data patterns, and decisions by seasoned analysts. Pairing this with our interactive data visualization for real-time scenario simulation refines decision-making and encourages cross-training and collaboration. This collaborative setting should foster shared expertise and constant improvement of both juniors and seniors in the field.
What More Can We Expect From the User-centric Cyber Security?
This blogpost marks the beginning of the practical phase of a user-centric design approach in cyber security software. The study’s findings and discussed thoughts are part of this approach – to align software user experience with actual users. Currently, we’re assessing the results from our ‘informational architecture and mental models alignment’ study, which are intriguing.
Spoiler alert: user mental models differ!
And we have numerous upcoming studies and workshops planned down the line. Stay tuned for more on this blog, and feel free to reach out!
More Blog Posts in the Series “From List to Graph View (FROG)”
This blog post on cyber security behavior is an article in the series “From List to Graph View” which is a collaboration and research project between Seculyze, Trusec and the IT University of Copenhagen funded by Cyberhub by DigitalLead. It is estimated to last a year. Read more articles in the FROG series:

About the author Lars P. Jerichau Clausen

Lars P. Jerichau Clausen
UX Research Rock star
Meet Lars, a full-time research assistant at the IT University of Copenhagen. With academic and industry experience in user research, interface design, and screen evaluation, Lars is passionate about creating efficient workflows and digital experiences for users. As an expert in UX and digital product design, he has a keen eye for detail and stays up-to-date with the latest trends in the field.