The cyber security visualization project between Seculyze, VENZO_ Cyber Security, and the IT University of Copenhagen aims to translate the one-dimensional list view of traditional analyst tools into interactive graph views for defenders. The vision is to design the next generation of analyst tools for the cyber security workforce.
If you’re defending the king’s valley, which would you choose: a list or a map?
The dissemination of the collaboration project is partly done through a series of blog posts. This first blogpost of the series delves into the core responsibilities identified for the project, and possible approaches to solve the challenges in cyber security visualization.
Designing the Next Generation of Analyst Tools
As cyber security expert John Lambert warns,
As long as attackers keep thinking in graphs, and defenders keep thinking in lists, the attackers will win
Efforts have been made to create such graph views in recent years – most notably the Microsoft Sentinel Investigation Graph. But the success of such a graph view for cybersecurity visualization remains unproven as the consideration for the user experience (UX) of the tool is neglected – as laid out by Nate Ruziacka in his MSI blog post “Are You Challenged with the Microsoft Sentinel Investigation Graph?”
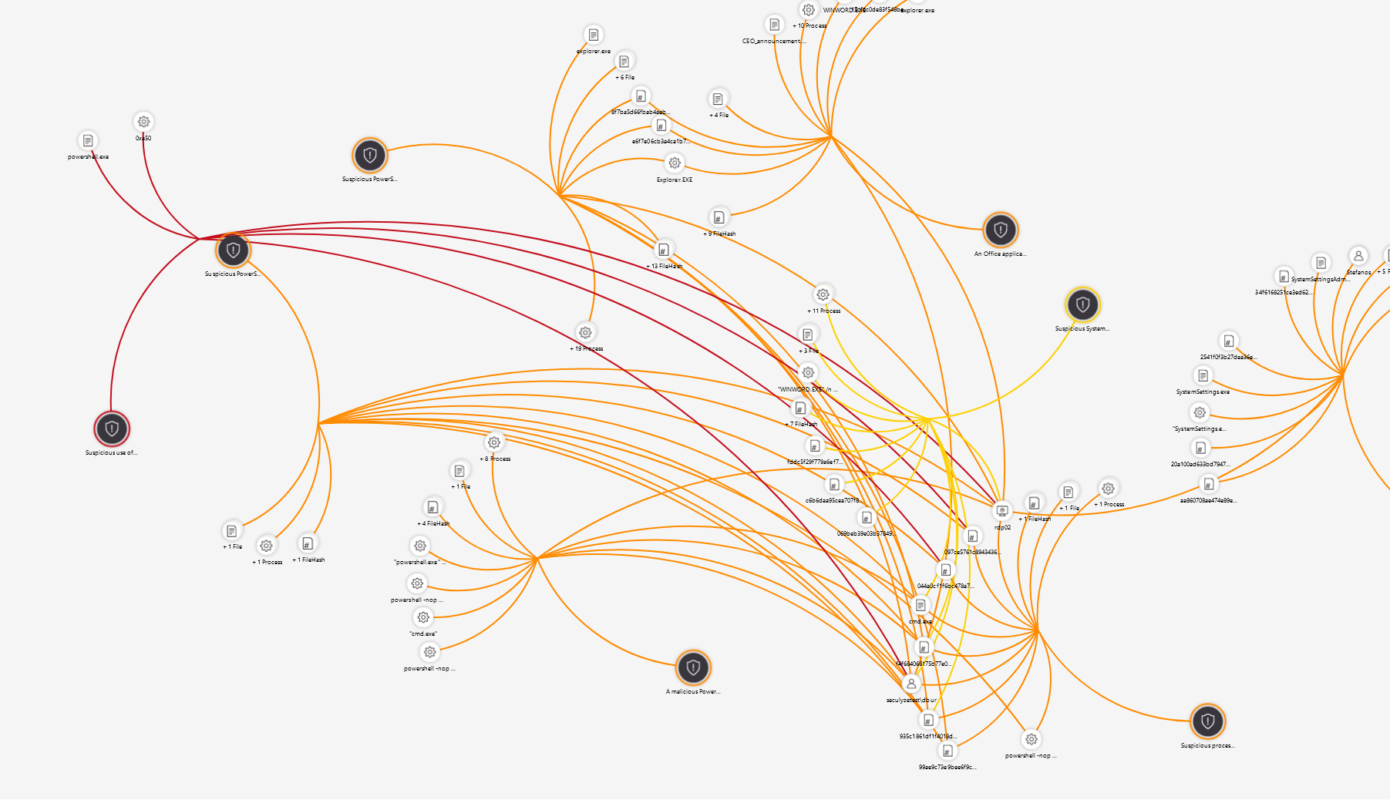
Screenshot of Microsoft Sentinel Investigation Graph.
Microsoft is opting for a two-dimensional and flat representation of their list views. We believe that this approach doesn’t fully capture the complexity of the data or benefit the analysts enough to warrant a shift in workflow and choice of tools.
Most existing graph views lack an adequate translation of data and careful UX consideration, which are crucial for empowering analysts in their workflow and results. To fully grasp the task at hand, we are considering the three core challenges that make this a unique opportunity for improvement through digital design.
- We need to facilitate an interaction with a vast and intricate data set.
- We need to support an existing workflow by expert users.
- We must ensure trust between software and users.
We’re in the midst of investigating these challenges, and how to best approach them. To avoid the pitfalls of previous attempts made by others, we’re rethinking how to create graph views for cyber security data visualization. Consider the first challenge: to accurately represent and interact with the complex data of cyber security. Complicated data visualizations can quickly overwhelm analysts, slowing down their workflow or even leading to mistakes that could compromise security. Finding a balance between information density and usability is a key challenge that we are actively addressing.
Approaching Cyber Security Visualization with Novel Concepts
We’re examining the notion of displaying only a few bits and pieces of data at a time, with the goal of providing users with precisely what they desire and require. No more, no less.
Fog of War obscures data from the player based on current activity. [From: Nybygger at English Wikipedia, CC BY-SA 3.0, via Wikimedia Commons]
Take the example of fog of war in games, which highlights where focus is needed and where effort can be extended. The concept is an example of how limited data can be utilized for minimizing cognitive strain and enhancing concentration. What we aim for is not to highlight data – that would be the job of the analysts and underlying software – instead we’re aiming to give analysts a tool to shine a spotlight on the data, through interactive data design.
We can draw inspiration from the concept of superimposing one flat data visualization on top of another in a two-dimensional graph view, such as contour lines on maps. Knowing the exact distance between each line is not key to understanding the map; instead, an expert user of topographical maps can decode and translate the lines into a mental model of the terrain with relative cognitive ease. However, providing an accurate view and interaction for cyber security visualization may require us to look beyond this approach and explore new ideas.
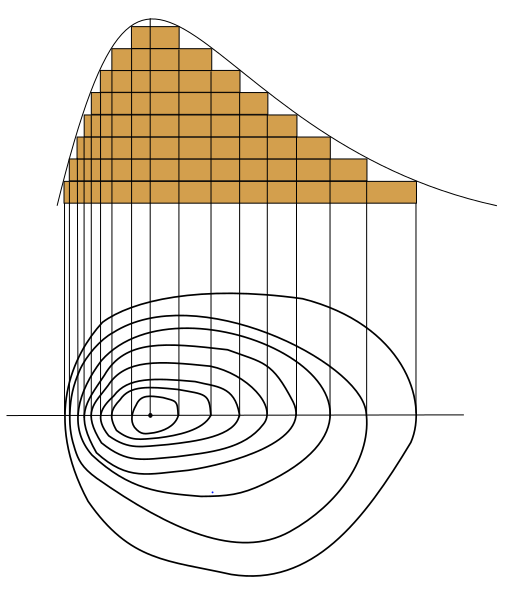
Countour lines on a map, indicates elevation of a terrain. [From: Romary at English Wikipedia, CC BY-SA 3.0, via Wikimedia Commons]
We’re pursuing new approaches for visualizing the intricate data set that cyber security defenders work with, encompassing data such as alerts, rules, incidents, networks, and entities. The intertwined and hierarchical structure of the data set poses a challenge for displaying it using traditional flat data visualization.
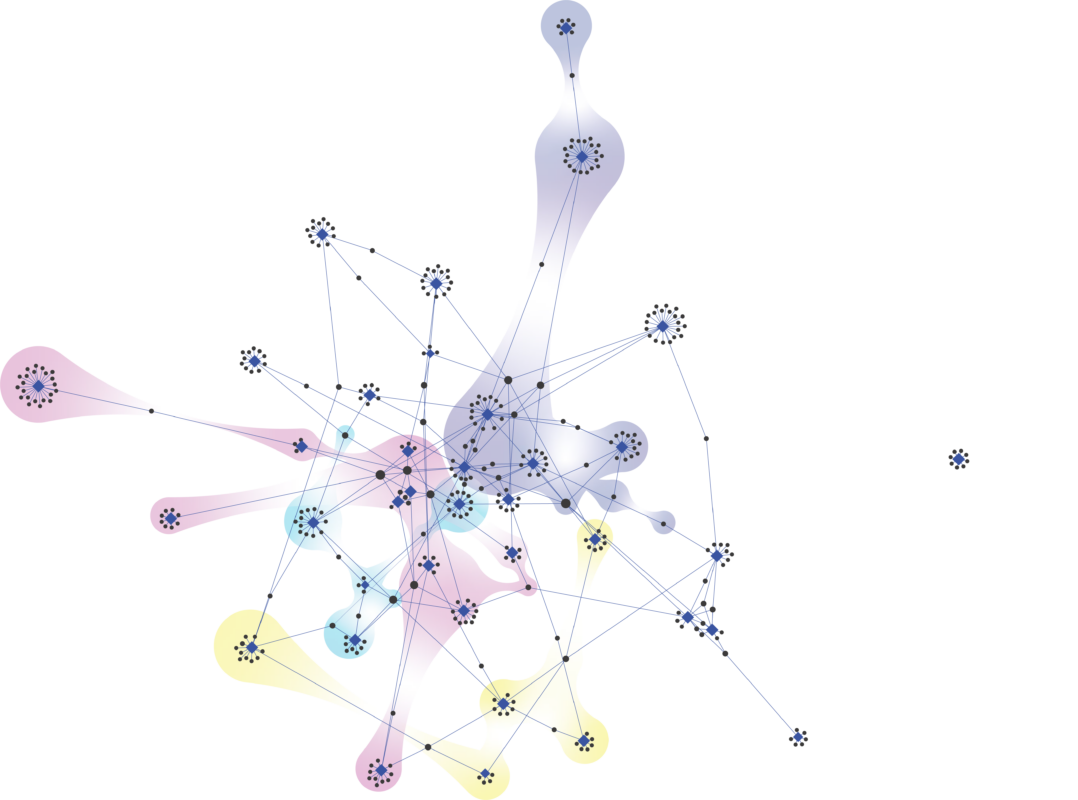
Network graph visualization showing bibliography and keywords.
[From: Ecpp at English Wikipedia, CC BY-SA 3.0, via Wikimedia Commons]
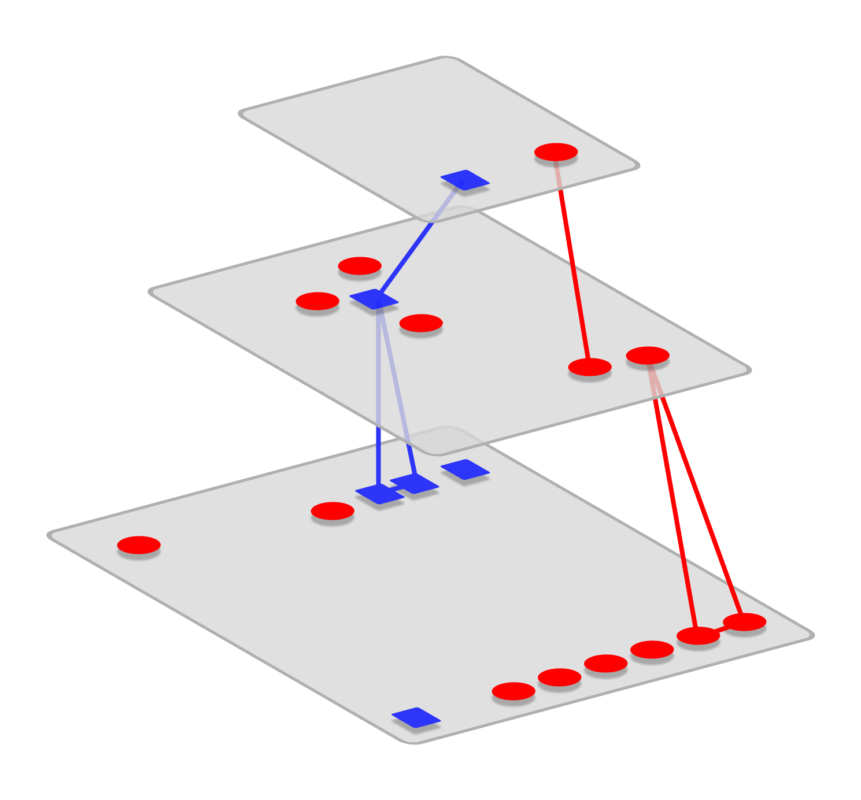
We can draw inspiration from other fields. This pyramid-like data structure is often seen in biochemistry.
[From: Sketch by author]
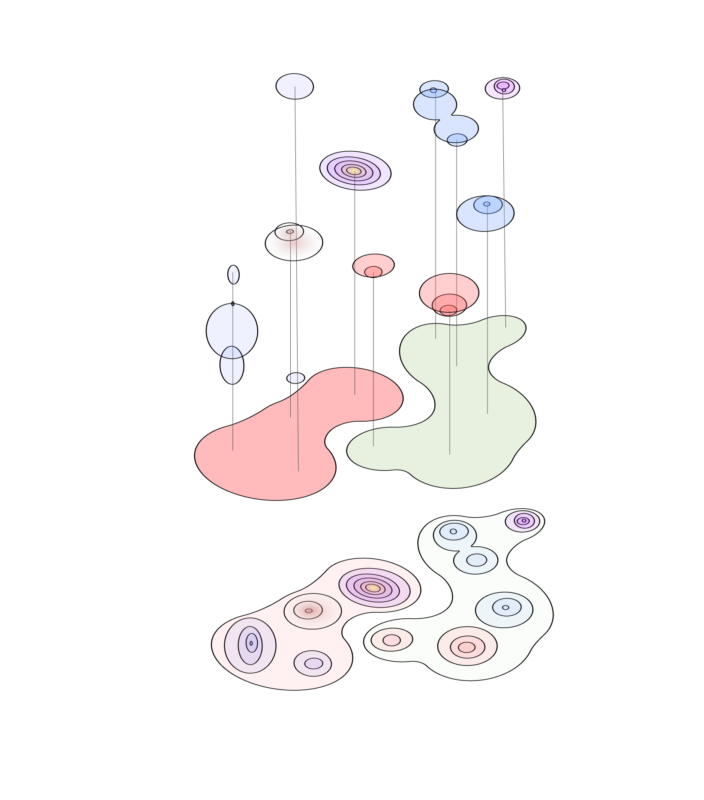
Combining multiple views is beneficial to explore data in it’s raw form, as well as getting an overview.
[From: Sketch by author]
Novel approaches for projecting data on top of each other in a three-dimensional data visualization have been seen in diverse fields such as chemistry, biology, and literature data analysis. We’re currently exploring the viability of implementing these data designs for cyber security visualization.
We’re aiming to apply the core concepts into UX principles that can be customized and applied to fit the specific needs, workflows, and preferences of our user base.
More blog posts in the series “From List to Graph View (FROG)”
This blog post is an article in the series “From List to Graph View” which is a collaboration and research project between Seculyze, VENZO_ Cyber Security and the IT University of Copenhagen. It is estimated to last a year. Read more articles in the FROG series:


About the author Lars P. Jerichau Clausen

Meet Lars, a full-time research assistant at the IT University of Copenhagen. With academic and industry experience in user research, interface design, and screen evaluation, Lars is passionate about creating efficient workflows and digital experiences for users. As an expert in UX and digital product design, he has a keen eye for detail and stays up-to-date with the latest trends in the field.
 Investigation flow on the most normal alerts
Based on the 10 most normal alerts, a generic investigation flow should be created. It is a decision tree that cyber security analysts can... Read article
Investigation flow on the most normal alerts
Based on the 10 most normal alerts, a generic investigation flow should be created. It is a decision tree that cyber security analysts can... Read article
 Baselining user behavior by machine learning
Add security intelligence to our software that can predict which alerts are based on "normal" behavior and should be prioritized down. Read article
Baselining user behavior by machine learning
Add security intelligence to our software that can predict which alerts are based on "normal" behavior and should be prioritized down. Read article